


![]()
The multi-site and multi-customer supervisor
EasyLink is a Niagara framework integrated application for a simplified management and configuration of a multi-site and multi-customer supervision system. It resolves the issues of multi-site systems, offering a solution that allows you to customize some graphical interface elements, adapting them to your needs.
EasyLink optimally supervises and controls every type of system, drastically reducing start-up and configuration times.
Features
- Automatic and dynamic portal creation.
- Automatic localization maps support.
- Weather services integration for the acquisition of historical and real time data.
- Customizable graphic themes and login page for each customer.
- Simple alarm routing and navigation support.
- Advanced HTML5 graphics configurable through chart builder.
- Customizable reports and dashboards for each user.
- Full screen presentation mode.
- Responsive graphic for mobile devices.
- EasyTunnel compliant.
From version 6
- User management panel.
- E-mail boxes management for an easy automatic report sending.
- Live Chart Builder for data visualization in real time, also on dashboards.
- Data import from CSV file on Chart Builder Standard through wizard and removal possibility.
- Customizable maps with live data.
- Customizable Gauge widgets available for both dashboards and Px views with the possibility of dynamically changing the displayed variable by drag-n-drop operation.
- ChartPreset widget available for both dashboard and Px view with the possibility of dynamically changing the displayed chart preset by drag-n-drop operation.
- Selection and color copy function in charts and dashboards.
- Automatic sending function of the selected CSV files in the report presets together with the PDF report.
- Dark theme available.
WHAT’S NEW IN EASYLINK 6? CLICK HERE

![]()
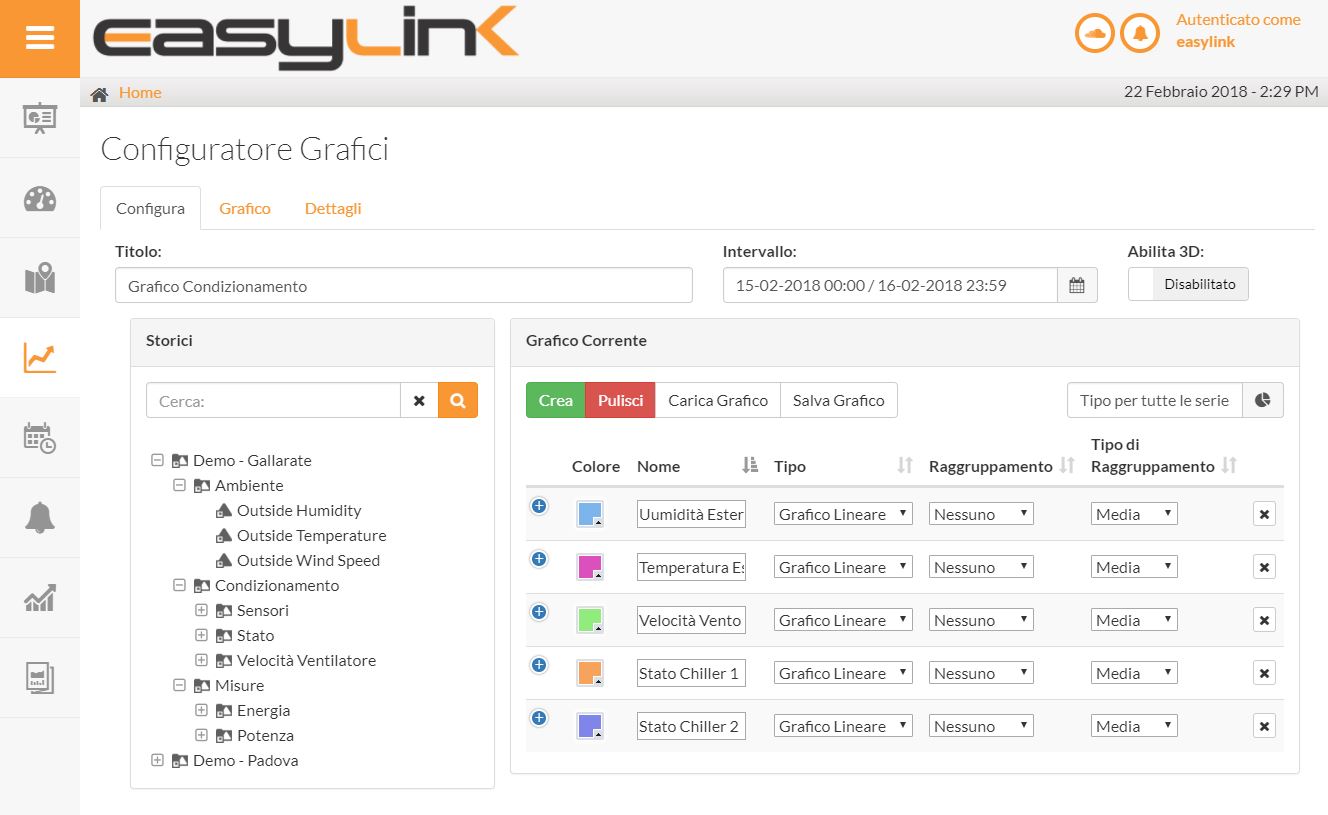
Advanced monitoring of energy data
EnergyLink is an optional module of EasyLink. It provides the user with a simple and intuitive graphical interface that allows the analysis of energy data, enhancing the stored historical data, to develop optimization strategies in order to reduce energy consumption. A powerful Chart Builder allows you to create a library of custom charts, reusable from the interface or widgets inside graphical views, energy reports and dashboards. The integrated energy alarm algorithm allows automatic detection and reporting of consumption anomalies. EnergyLink facilitates decisions and makes possible to monitoring the results, measuring the savings.
Features
- Missing data compensation with peak suppression.
- Data visibility due to user credentials.
- Simplified energy chart builder.
- Aggregation of historical data.
- Drill Down function.
- Comparison and analysis charts.
- Standard and advanced energy alarm algorithm.
- Periodic customizable energy reports.
- Import of bill data.
- Management of consumption accounting.
- Benchmarking based on the energetic features of sites.
- Possibility to use virtual meters in all Chart Builders.
- Multiple regressions management.
- Accounting for consumption costs.


![]()
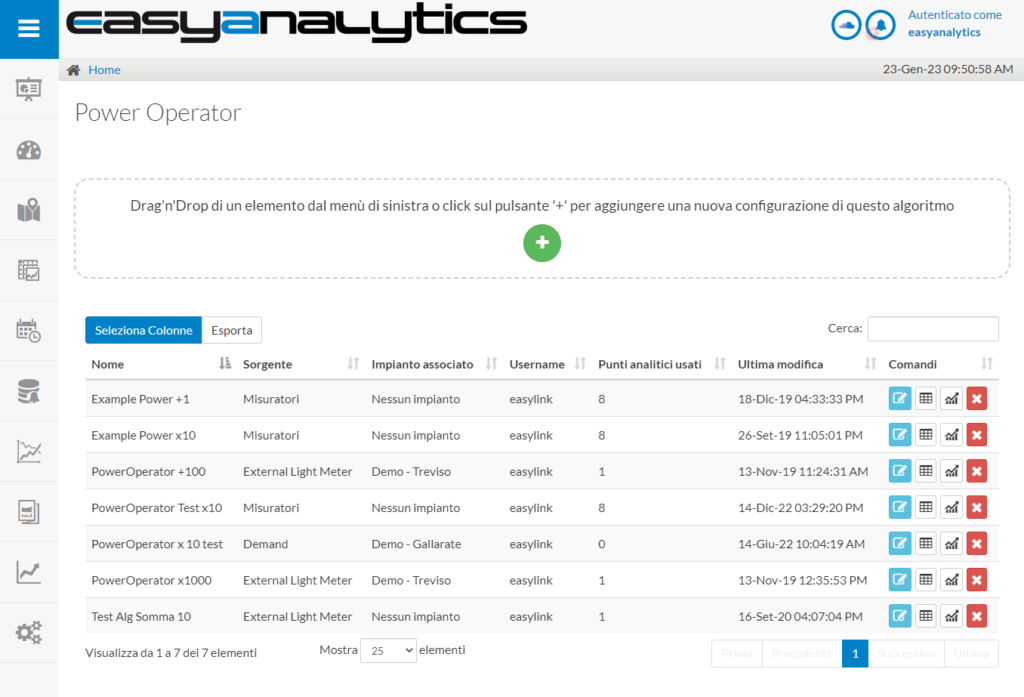
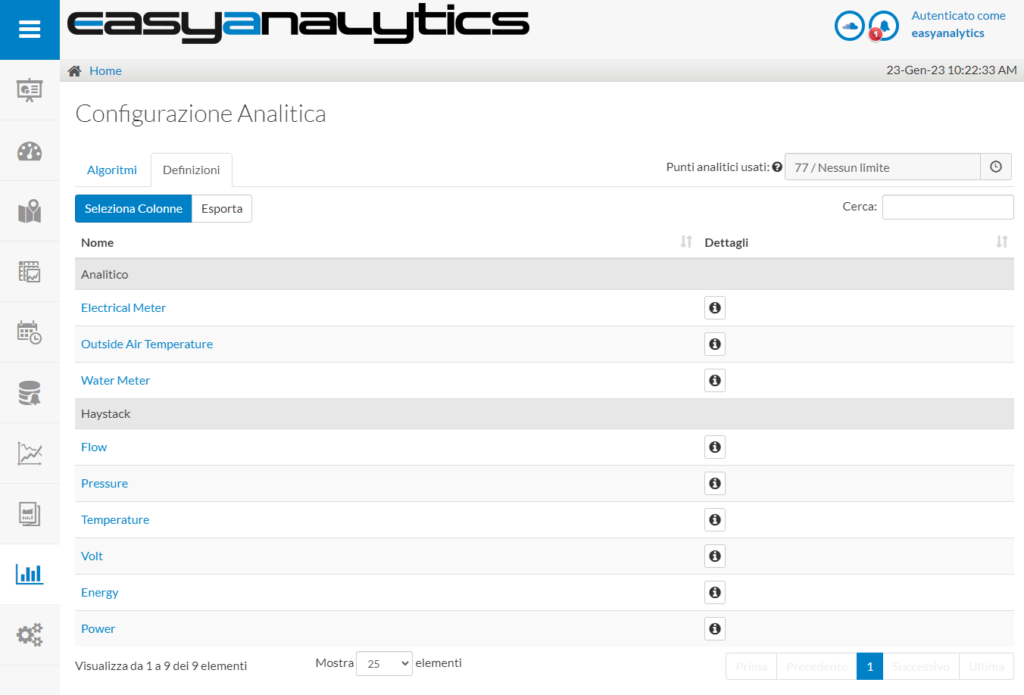
EasyAnalytics is an optional software module of the Supervisor EasyLink; it allows the integration and the simplified use of the Framework Analytics of Tridium inside EasyLink.
Thanks to a simple and intuitive user interface, it is possible to manage the analysis of historical and real-time data, to develop optimization strategies for the entire integrated system.
A powerful Chart Builder allows to create a library of custom, reusable charts on graphical views, analytic reports and dashboards to help visualize operations and remove inefficiencies.
It is ideal for proactive plant management to identify anomalies and assist the operator in implementing corrective actions.
Caratteristiche
- Perfectly integrated in the EasyLink user interface.
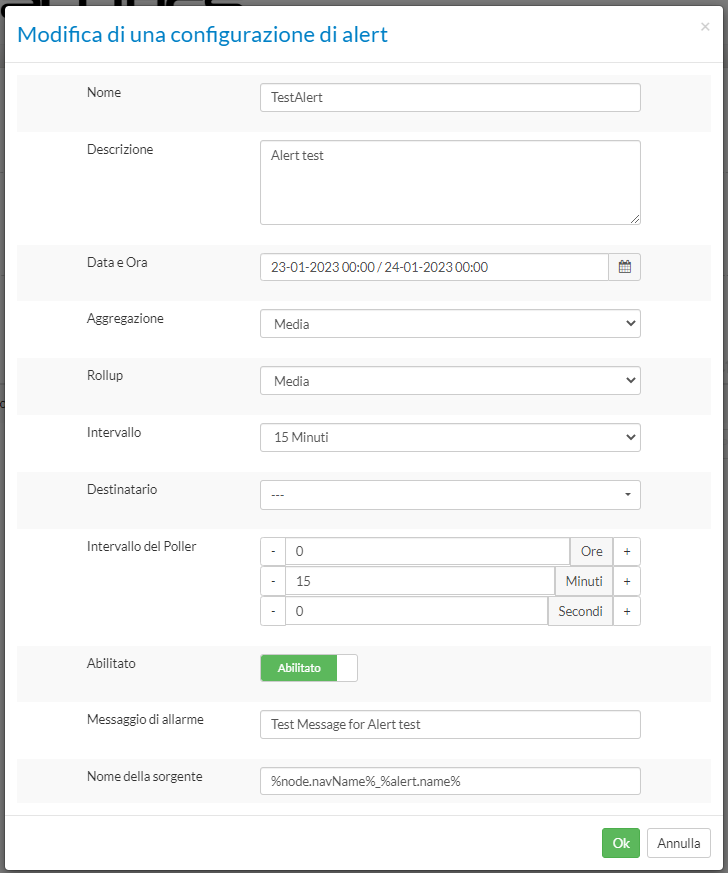
- It allows simplified configuration of algorithms and definitions through the use of wizards.
- Online viewing of algorithm documentation and definitions for an easy use via browser.
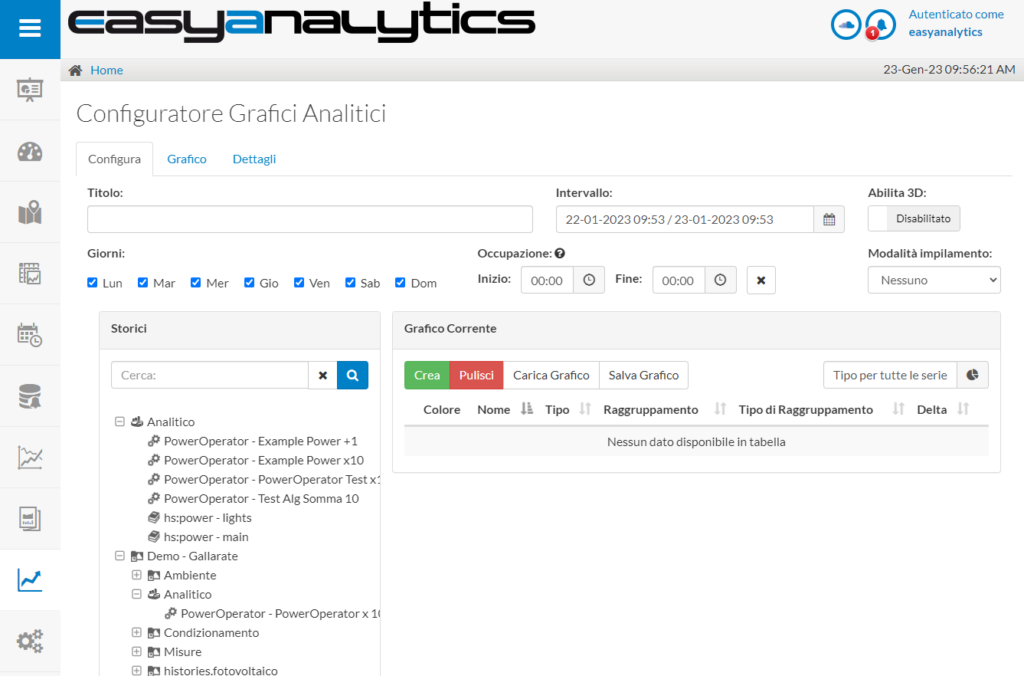
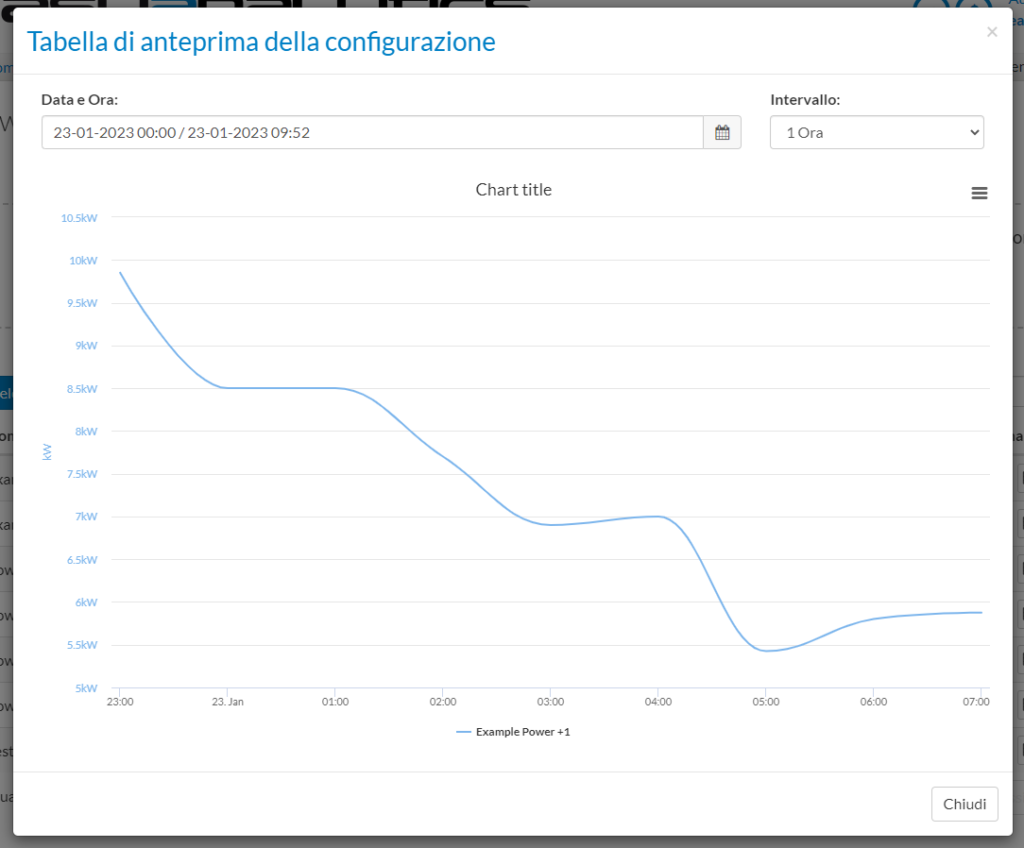
- Dedicated chart-builder to display analytical results and standard historical data in one single chart.
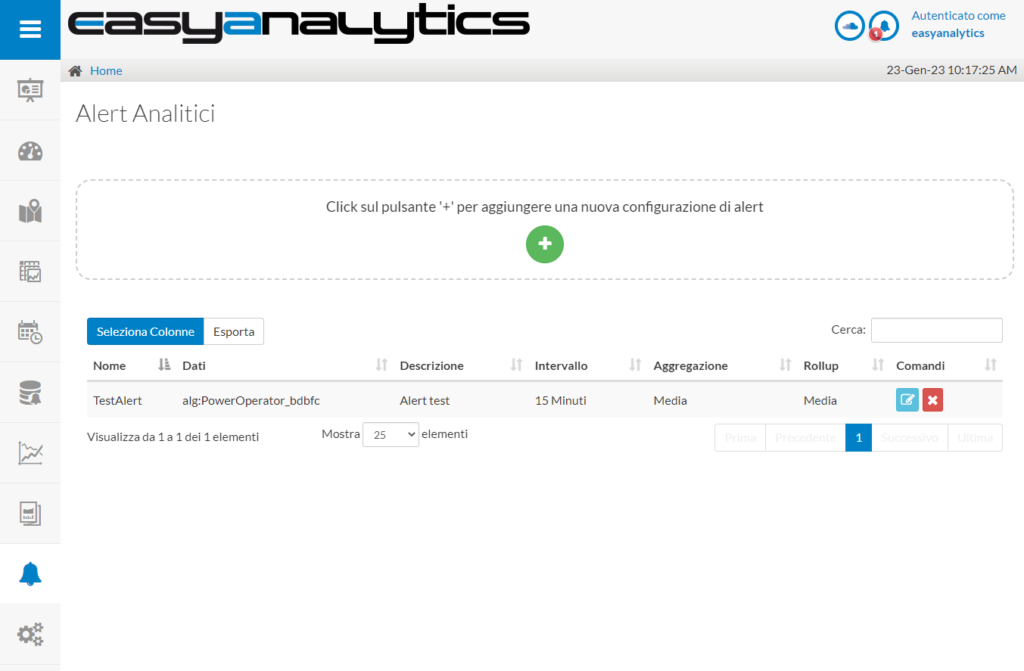
- Integration of analytical alarms for sending notifications.
The license of the module is based on the number of analytical points* you want to manage with different sizes available and it is subject to the license of the Tridium Analytics framework. Product updates require active maintenance. 25 points of EasyAnalytics are included in every EasyLink Supervisor with active maintenance.
*The Tridium analytic points license is not included in the EasyAnalytics license
![]()
Receive notifications and manage Niagara alarms from smartphones and tablets

Easy Notification App is the application by QuickLink Solutions that allows to view Niagara alarms notification from any smartphone/tablet and manage them through a simple, intuitive and customizable interface.
Thanks to the Notification Client module, the use of the Easy Notification App for alarm management can be integrated into JACE controllers and N4 Web Supervisors! All the components of the Notification Client module are integrated into the Niagara framework, allowing better efficiency in systems engineering and maintenance with a consequent reduction in costs.
Notification Client and Easy Notification App can be used in combination on all platforms that support the Niagara N4 Framework, such as JACE controllers or the N4 Web Supervisor and with all supported smartphones (Android 11 or higher; iOS 14 or higher)
FEATURES
- Notifications on smartphone/tablet of alarms detected by Niagara.
- View status of active alarms, alarm history and notes.
- Management of alarm status through native device notification system.
- Color code to indicate active, inactive, acknowledged and unacknowledge alarms.
- Filtering and sorting of alarms based on customers, plants and dates.
- Free search on the most important fields of alarms.
- Simple, intuitive and customizable interface (colors and theme).
- Multilingual support: English, Italian and soon German, Spanish and French.
- Configuration of the associated devices thanks a unique token generated by the app.
The app is available for Android and iOS and you can download it from Google Play Store and App Store.
Download the APP for free via QR CODE.

For a correct running of the EasyNotification App, the Notification Client license must be activated.
If you have activated an EasyLink license with maintenance, the Notification Client license is already active for up to 3 devices without any additional cost.


![]()
Full control at your fingertips

EasyLink App is the application for mobile devices to access the information of all the systems integrated in the EasyLink supervisor from any smartphone/tablet and manage them through a simple, intuitive and customizable interface. You can connect to one or more EasyLink supervisors using the credentials of Niagara users in the system.
EasyLink App is native on the Niagara platform and uses the new EasyLink API to interact with all system management functions, such as reading and writing values in real time, alarm management, time schedules changes and graphic visualizations of the historical data trends.
The app is available for Android and iOS and can be downloaded from the Google Play Store and App Store.
FEATURES
- Bi-directional integration with the new EasyLink API
- Ability to connect to one or more EasyLink supervisors using existing Niagara credentials
- View of the map and list of systems with related statuses
- Display of nodes and configurable sub-sections
- Navigation between systems, nodes and sub-sections with segregation by user
- Configurable views for managing properties in node sub-sections
- Modification of the writable values in node sub-sections
- Scheduler management
- Graphical trends display of historical data
- Integration of weekly time schedule and calendars
- Customization of colors and theme
- Multilingual support (Italian and English)
Integrated alarm management
- Display of global alarms or individual plant
- Possibility to apply different filters for simplified search
- View of all alarm details, including notes
- Possibility to select and acknowledge alarms
- Integration of note input function
- Enabling alarm notification
Download the APP via QR CODE.

EasyLink App is included with EasyLink supervisor, version 6.10.0.0 or higher, with active maintenance (SMA).